


2018 School Spending Survey Report
School Library Journal's Spending Survey 2009
 |
| Illustration by Tom LaBaff. |
Staffing cuts to the bone
Despite the recession, the vast majority of media centers around the country have retained their credentialed media specialists. For example, almost 85% of elementary schools and more than 95% of middle and high schools have a full-time certified librarian (Table 1). While there are still several states that don’t require media specialists to earn post-baccalaureate degrees, almost all of them have advanced degrees, most often in library/information science. About a quarter of these library media specialists (LMSs) have earned a master’s degree in education, and high school librarians are most likely to have an advanced degree that focuses on librarianship. Almost always, if a full-time media specialist is not present, a half-time professional (either certificated or with a master’s degree in librarianship) oversees the library. In addition, salaries have not declined. While elementary school librarians’ salaries remained the same as in 2004–2005 ($48,000, which does not take inflation into account), both middle/junior and high school librarians experienced a median $2,000 raise (to $54,500 and $52,000, respectively), with average salaries gaining $4,000 for middle/junior high librarians (to $56,219) and even more for senior high librarians (to $56,960). The salary range for LMSs is surprisingly wide, probably because some K–8 librarians are supervised by a district media specialist. For those LMSs who work at least 30 hours per week, elementary school salaries ranged from $15,680 to $113,000, middle/junior high salaries from $13,000 to $120,000, and senior high salaries from $28,000 to $95,000. Generally, the higher the grade level taught, the greater the number of years of LMS experience (Table 1). Nevertheless, the mean number of years of school experience has declined from 15 years in 2004–2005 to 12 years in 2007–2008. Furthermore, elementary school and middle/junior high LMSs are now averaging a year less experience (both averaged 19 years in 2004–2005 and 18 years in 2007–2008), with high school librarians averaging three years less experience—from 20 years’ experience in 2004–2005 to 17 in our most recent survey. Interestingly, the spread in years of experience is very “flat.” Although many observers had predicted there would be a shortage of media specialists—given the high number of those retiring or soon-to-be retiring—the survey’s figures seem to belie the expected crisis. On the other hand, the percentage of library media centers (LMCs) with paraprofessional staff has declined since the 2004–2005 data, from an average of one in 2004–2005 to 0.77 in 2007–2008 (Table 1). Adding the number of full-time and part-time staff, the average number of paid library staff held steady across all grade levels. In elementary schools, such staff are likely to be part-time, and by high school about three-fourths have a full-time paraprofessional. The median number of parent volunteers has also decreased, to practically zero. On a happy note, the number of student volunteers has increased about 20% across all grades since 2004–2005, which might correspond to the rise in community service requirements for some schools.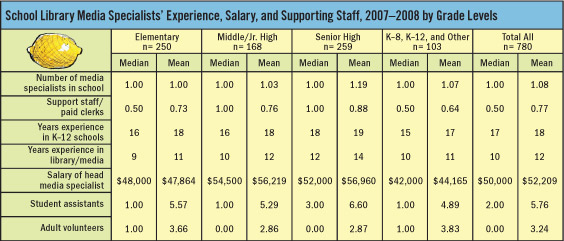 |
| Table 1 |
Budget constraints impact media center efforts
Comparisons between 2007–2008 expenditures and the 2004–2005 figures show consistent decline or stasis except for purchases of CDs and other software, which were 11% higher than in 2004–2005 (Tables 2 and 3). While Internet subscriptions held constant at $2,000, the median expenditures for books declined 15% to $5,435, AV purchases dropped 41% to $500, and periodicals declined 31% to $700. Several media specialists in rural areas and in older and smaller schools felt they were negatively impacted by budget constraints. Respondents mentioned how districts “took back” library budgets or considered media centers a second priority. Budget cuts did impact technology support.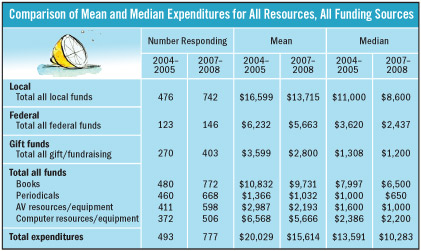 |
| Table 2 |
Library collections remain static
School library collections have been getting smaller since 2004–2005 (Table 4). The average net gain of books for the 2007–2008 academic year varied from 268 in elementary school libraries to 30 in high school libraries, largely because media specialists weeded out more volumes than in 2004–2005. Interestingly, even though more LMSs got rid of additional items, about 42% of respondents stated that 11% to 30% of their collection was outdated. |
| Table 3 |
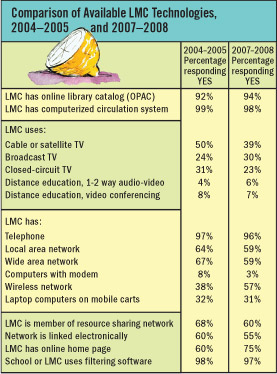
Technology access peaks
Almost all of the respondents have Internet-accessible computers in their media centers. That said, more than 95% have some type of filtering or blocking software, such as NetNanny, CyberPatrol, or BSafe. The average number of computers in school libraries rose by grade level—from 10 computers in elementary school media centers to 18 in middle/junior school to 27 in high schools. Similarly, the likelihood that media specialists would manage a computer lab also increased with grade level, and slightly more than half had such responsibilities. It should be noted that the average number of computers in a lab peaked at 34 in middle school, which might reflect more project-based learning or larger class sizes. Ironically, about 10% of elementary school libraries still don’t have a telephone.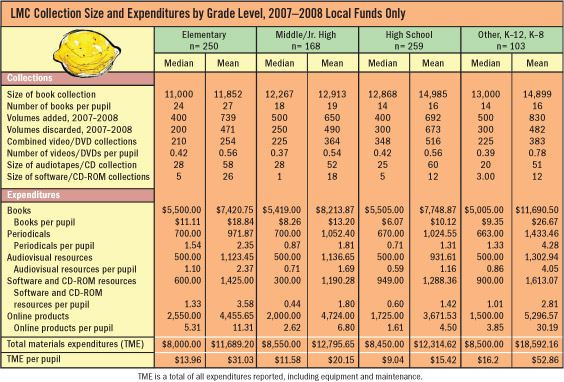 |
| Table 4 |
 |
| Table 5 |
 |
| Table 6 |
Technology use goes interactive
The use of technology for administrative tasks is now the norm, with specific functions such as acquisitions, cataloging, and circulation incorporating technology to about the same degree in 2007–2008 as in 2004–2005 (Table 7). Interlibrary loans at all levels have increased slightly (from 54% to 58%), possibly owing to fewer acquisitions. Formal library reports are produced by almost 90% of respondents, probably reflecting the emphasis on school—and media center—accountability. Use of technology by LMSs for teaching and learning has also changed since 2004–2005, reflecting shifts in production emphases, reading strategies, instruction, and communication. Certainly the use of the Internet is dominant—especially email (Table 8). As it becomes increasingly harder for librarians to find time to interact with their colleagues, email has provided a reliable way for 86% of the respondents to keep in touch. Second in popularity, at 85%, is Web searching and reference. Most schools take online information in their media centers as a given, and librarians can leverage that by helping |
| Table 7 |
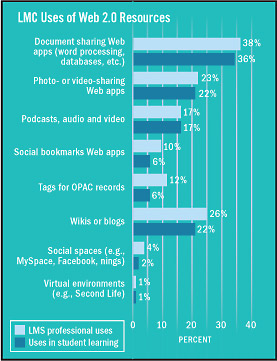
Web 2.0
Current trends may indicate that “traditional” computer instruction is needed less now and that the more interactive, dynamic, skills—such as creating blogs—are more useful. For example, almost one-fifth of the respondents now use podcasts and a quarter use blogs and wikis. In 2004–2005 only a couple of respondents mentioned these Web 2.0 applications. Computer-based photo-editing services have declined, replaced by online photo- and video-sharing, which increased by a quarter of the respondents.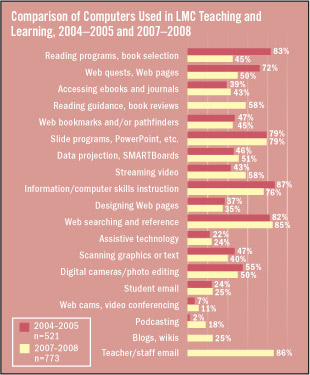 |
| Table 8 |
 |
| Tables 9 |
Collaboration and planning grows
School libraries are open more hours as grade levels increase and scheduling becomes more flexible. About two-thirds of elementary school librarians have fixed schedules, and nearly another third use a combination of fixed and flexible schedules. Middle school librarians flip-flop these percentages: about one-third use a flexible schedule, and two-thirds employ a mixed fixed/flexible schedule. In high schools, 85% of media specialists have a flexible schedule, and 11% use a combination fixed/flexible schedule. About half of elementary school librarians, two-thirds of middle school librarians, and almost three-quarters of high school librarians plan regularly with their classroom counterparts. While a smaller percentage of classroom teachers plan with librarians as grade levels increase, the amount of time in formal and informal planning steadily increases with grade level. The message is that the higher the grade level, the more teachers and librarians collaborate, most likely because their lessons are more complex and nuanced.Takeaways
This year’s SLJ survey data shows that regional differences have largely disappeared. Additionally, the actions of beginning and veteran librarians show little difference in practices, although newer media specialists tend to use more Web 2.0 technologies, and more experienced media specialists subscribe to more databases. Nevertheless, three trends emerged from the current 2007–2008 survey responses: School librarians have opted for “lean and clean” collections. Fewer items have been added, and more weeding means less outdated material. Media specialists are subscribing to fewer databases, or at least are being more selective about them. “Traditional” library technology has hit a plateau. There are no great plans to add more equipment. Overall, it appears that librarians have reached a mature level of technology use: transcending the novelty and potential of technology to choose effective resources that provide a unique niche for library services built on their specialized knowledge and experience. On the other hand, participatory technology—and participation in general—seems to be the next wave that media specialists need to ride. Web 2.0 offers a wonderful chance for the school community to contribute to the library and the school’s knowledge base in general, and the library can emphasize its support of authentic student knowledge production. The bottom line? Librarians are hunkering down during these lean times, presenting their best face and prioritizing expenditures carefully.| Author Information |
| Lesley Farmer (lfarmer@csulb.edu) coordinates California State University Long Beach’s librarianship program. Marilyn Shontz (shontz@rowan.edu) is an associate professor in the school library media program at Rowan University in Glassboro, NJ. |
In January, we followed up with the participants in our spending survey to learn how their budgets would fare in the 2009–2010 school year. We knew the best anyone could provide would be an educated guess. Nevertheless, with the economy tanking, we were eager to get a sense of how hard school libraries would be hit. Overall, a full 54% of respondents expect to see their budgets decrease, 39% anticipate no change, and 7% think their budgets will increase. High school librarians anticipate the most change, with a full 61% bracing for a decrease, 29% foreseeing no change, and an optimistic 10% expecting an increase. The mean projected high school budget is $17,818. What’s contributing to the decline? Far and away the leading factor is a decrease in state funding, with California, Florida, Michigan, and New York librarians being the most vocal. As one participant wrote, “We are a public school in Florida. Enough said?” Other factors include weakening local support—often spurred by softening tax revenues, especially property taxes—and drops in enrollment. Many librarians just listed “the economy,” while one participant wrote, “Sorry—too depressed to comment. I’ll feel very fortunate if I am still employed next year!” Budget increases were most often attributed to successful bond passages, increased funding for technology and databases, expanding enrollments, and “praying to God.”
Almost one-third of respondents work in schools with enrollments between 200 and 499 students and almost a quarter work in schools with more than 1,000 students. Eighteen percent work in schools with 750 to 1,000 students and less than 4% work in schools with less than 200 students. Recognizing the technology tipping point, this year’s SLJ survey was conducted online for the first time. In December SLJ emailed the survey to a sample of more than 2,000 of its subscribers, with a nearly 35% return within the month. After eliminating those responses that lacked budget information and other vital data, the researchers identified 780 valid responses. In comparing the demographics of those responses with the most recent available statistics about school libraries collected by the National Center for Education Statistics, the researchers found that the sample was representative of schools having professional librarians. About 90% of responders represented public schools, 8.5% represented private schools, eight charter schools responded, and two joint school/public libraries responded.

Added To Cart
RELATED


RECOMMENDED
CAREERS
The job outlook in 2030: Librarians will be in demand
CAREERS
The job outlook in 2030: Librarians will be in demand
ALREADY A SUBSCRIBER? LOG IN
We are currently offering this content for free. Sign up now to activate your personal profile, where you can save articles for future viewing
ALREADY A SUBSCRIBER? LOG IN
Thank you for visiting.
We’ve noticed you are using a private browser. To continue, please log in or create an account.
Add Comment :-
Be the first reader to comment.
Comment Policy:
Comment should not be empty !!!