


2018 School Spending Survey Report
SLJ’s Spending Survey: As the economy limps along and federal dollars dwindle, school librarians are turning into resourceful survivors
Thank goodness we’re a resourceful bunch. How else could media specialists have survived this protracted recession, where our colleagues continue to get pink slips, budgets keep getting slashed, and we constantly have to defend what we do?
How have things changed since we published our last spending survey in April 2009? Our latest SLJ survey of school expenditures and collections for 2009–2010 shows that librarians have used a variety of coping techniques to weather this economic storm, whether it’s servicing more than one school, using additional volunteers, taking on more tasks, or seeking outside funding. “Nearly all resource purchases are done via donation or grant writing,” writes one of the resourceful 833 library staffers who responded to our budget survey.
No doubt, knowing how others are holding up helps us better gauge where we stand—and provides more ammunition when it comes to asking for what we need. What we found is that huge inequities remain. Overall, elementary school libraries continue to be short-staffed, and they had shorter operating hours than other school levels. Middle schools had the least technology. And high schools were the hardest hit budget-wise. But it’s media specialists in Western states like California and Arizona who had it the hardest, having suffered the brunt of the financial fallout. While the economy continued to chip away at library budgets nationwide, Western states, which have the largest schools, had less library staff and smaller budgets than their counterparts in other regions.
Disappearing dollars, beleaguered budgets
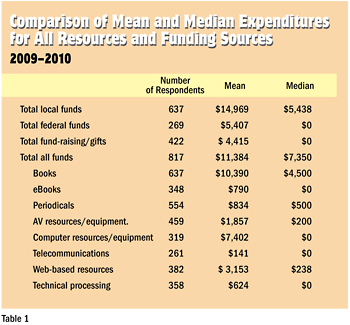
Although some states, such as North Carolina and Texas, saw new K–12 schools sprout up and receive sizeable financial support, for the most part, states were scrambling for money. In general, the West fared worst. For that reason, both the mean and median figures are reported in table 1. Generally, federal funding failed to relieve strained site budgets, which suggests a greater reliance on local discretionary allocations and fund-raising as the recession dries up donors’ pockets.
Fortunately, some materials and services, such as periodicals and technology, were funded from other budgets at the local, district, and state levels. In addition, almost all states provided school libraries with statewide database subscriptions.
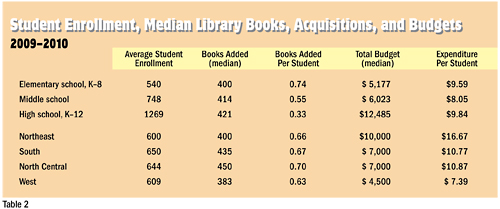
Some differences in budgets by grade level and region are shown in table 2. Middle school libraries fared worse than other grade levels, and in the Northeast, the amount of money spent per student was more than double the amount spent by school libraries in the West. It should be noted that in our last survey, for the 2008–2009 school year, it was anticipated that the mean high school budget for 2009–2010 would be $17,818. In actuality, it was $18,165, but the median was less than $13,000; and the range was zero to $300,000. Thus, the top tenth of school libraries were very well funded (especially new ones with strong opening collections), were successful at fund-raising, or had strong administrative support. But the majority of school libraries didn’t experience robust financial health.
Throughout the nation, about a third of libraries had their budgets slashed, while one-half had no change, and an eighth saw an increase. High school libraries seemed to be hardest hit, probably because their collections tend to be bigger than those in middle and elementary schools, so it appears that they’re not in much need of funds. Even though high school libraries are increasingly using digital resources, only a tenth of them had increased budgets, and almost 40 percent had decreased budgets. For those libraries whose budgets increased, the national median was 20 percent for elementary school libraries, 13 percent for middle school libraries, and 10 percent for high school libraries. On the other hand, the median decrease was 28 percent for elementary school libraries and 20 percent for both middle school and high school libraries. As for changes in budgets, more variation existed within regions than among them.
Elementary school and middle school libraries were twice as likely to get outside funding (about 40 percent) than high school libraries (20 percent). They were also more likely to host book fairs and receive community donations. Interestingly, about half of K–12 school libraries received outside funding. As the economy continues to stagnate and government funding diminishes, the message seems to be that schools, in general, and school libraries, in particular, need to supplement their income in order to maintain quality collections and services. In parsing out the outside sources, no one funding group (such as book-fair vendors) was listed by more than 10 percent of the respondents. Local funders such as businesses, nonprofits, and parents were the main sources of funding and five times more likely than nonlocal funders to provide funds. At every grade level, outside funding was used for many purposes, but mainly resource sharing (11 percent), books (10 percent), supplies (10 percent), and telecommunications (7 percent).
The state of things
Geography plays a huge role in library staffing. Schools in the West were less likely to have a professional librarian than those in other parts of the country, which tended to have at least one full-time librarian. The South seemed to be better staffed than most regions, with an average of 1.3 librarians per school, but it also tended to have less paraprofessional help. Around half the time, libraries in the Northeast and the South had full-time paraprofessionals, and two-thirds of North Central sites had one. Once again, the West was in the worst shape, with only about a third of its libraries having full-time paraprofessionals. The West was also most likely to have a half-time school librarian. Not surprisingly, then, the West was more likely to have adult volunteers (an average of 3.5, with at least one as a median) and student volunteers (a median of three) as opposed to one for sites in the Northeast and two for the South and North Central areas. One might speculate that the differences in staff are due to budget, school size, and state or regional accreditation mandates.
Not that the Western school librarians earned more. That privilege went to those in the Northeast, with a median annual salary of $62,000 in comparison with $50,000 for the rest of the nation. It should also be noted that high school librarians nationwide had a median salary of $57,800, as opposed to school librarians at other levels (elementary median salary was $50,000, middle school average salary was $56,000, and other school levels’ average salaries were about $48,000).
The average number of work experience for head library staff was between nine and ten years, regardless of site level or region; the South and West had more veteran K–12 staff, averaging about 18 years. High school librarians averaged 17 years of educational experience, in comparison with elementary and middle school librarians, who averaged 15 years.
The West also has the largest student enrollments, most sharply at the high school level, where the median number of students was 1,450, compared to 1,225 in the South, 980 in the Northeast, and 820 in the North Central. The South and West had about 800 average enrollment in middle schools (compared with 660 in the Northeast and 600 in the North Central), and 500 in elementary schools (compared with 450 for in the Northeast and in the North Central).
It should be noted that there was no significant difference in library hours relative to region. On the other hand, about a third of elementary school libraries were open less than 34 hours a week, as opposed to one-sixth of middle school libraries and nine percent of high school libraries.
 Shelf life
Collections remained stable, and experienced slight net gains across the board. There was no regional difference in the size of collections at any grade level. Nationwide, the median number of books at the elementary and middle school levels was 12,000; the median number at the high school level was 14,000. Across the country, the median number of books weeded in elementary libraries was 200 in middle school libraries 300, and for high school libraries, 250.
Most librarians, regardless of school level or geography, said that between 11 and 30 percent of their collections were out of date (respondents self-defined the term). Elementary collections were more likely to be current (about a quarter of respondents thought that 90 percent or more of their collections were current), and high school collections were most likely to be largely out of date (almost a tenth of respondents).
A little less than half of Southern and Western school libraries housed non-English materials; and about 55 percent of school libraries in the Northeast and 36 percent of those in the North Central collect them. Looking at the languages that respondents mentioned, it appears that the two main reasons for collecting non-English materials are curriculum and student population ethnicity. Nationwide, a small majority of high school libraries collect non-English materials; 43 percent of middle school and 39 percent of elementary libraries do. Spanish materials were overwhelming the top choice with 95 percent. Second in popularity (about one-sixth) were materials in French, and a distant third (about 5 percent) were Chinese or German materials.
Across levels, two-thirds of school libraries have access to statewide digital resources. A third of school libraries (a quarter at the elementary and middle school levels, and a slight majority of high school libraries) chose digital resources beyond those provided by the district or state. More than 70 digital products, such as reference titles, database aggregators, and ebooks (usually identified by company name, such as Salem) were identified by respondents as part of their collections—or subscribed by them. Not counting video-steaming products (noted below), the products most often acquired were from Gale: by one-sixth of the schools. EBSCO’s products were noted by a tenth of the sites (ProQuest, Wilson, eLibrary, SIRS, Infotrac, JSTOR, Project Muse, and NetTrekker were also mentioned). World Book was the most popular online encyclopedia, cited by 13 percent of the respondents. Britannica was noted by 5 percent and Grolier was cited by 4 percent. Other types of products mentioned by one to three percent of school libraries include:
Reference: Facts on File, Marshall Cavendish, Oxford University Press (especially their dictionary), Salem Press, Sharpe, ABC-CLIO, Scholastic Health: Rosen’sTeen Health and Wellness Geopolitical titles: Culture Grams, Country Watch, Country Reports, World & I, Congressional Quarterly, Current Biography, several map collections Other subject-specific sources: Art Museum Gallery, Mango (language) Newspapers: Newsbank, America’s Historical Newspapers Reading: Renaissance Learning (Accelerated Reader), PebbleGo, TumbleBooks General learning sites: Enchanted Learning, Study Island, Teaching.net Bibliographies: Novelist, LibGuides Intellectual property tools: Noodle Tools, EasyBib, Turn It In
The variety of topic and titles was impressive, and all levels of libraries subscribed to these products. While the standard general database aggregator companies, such as Gale, EBSCO, and ProQuest, are well-represented, the specific digital resources chosen show that school libraries are focused on subscribing to digital resources that are tailored to their curricular needs.
About three-quarters of elementary and middle school libraries and almost two-thirds of high school libraries subscribe to streaming video services. Discovery Education streaming is the favorite at all levels. Safari is a distant second.
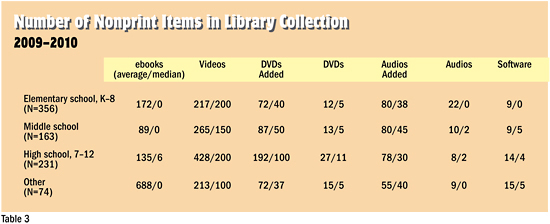
At the time of this survey, ebooks had not reached a critical mass, although the figures are somewhat encouraging. A little more than 50 percent of elementary school libraries and almost 60 percent of middle school libraries had no access to ebooks. About 43 percent of high school libraries had no such access. About 20 percent of elementary and middle school libraries had access to over 100 ebooks, and about a third of high school libraries had such access. However, a little over 10 percent of high school libraries had access to over a thousand ebooks.
In terms of other nonprint materials and multimedia products, growth was consistently small: about 20 percent across media, for relatively small collections, although some school libraries had significant nonprint collections. Audio collections grew about 50 percent across levels since 2007–2008, while videos and DVDs remained fairly flat in the same time period.
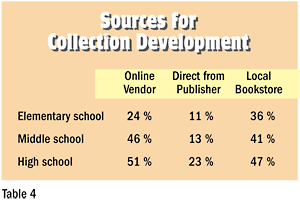
About 90 percent of school libraries at all levels handled book selection at the local level, which enables them to address community-specific needs. Only about one percent, scattered by level and region, had solely centralized selection. Roughly a tenth used a combination of site and centralized selection.
While about two-thirds of school librarians across all levels used Follett as their main vendor for book purchasing, most used another vendor as well. The second-most popular among elementary school librarians (10 percent) was Bound to Stay Bound, and in middle school libraries it was Permabound and Mackin, both tied at 6 percent. High school librarians, however, had little consensus in their choice of vendors, with Amazon being the second-most popular at 4 percent. Junior Library Guild and Barnes & Noble were frequently used at all levels. Middle school and high school librarians turned to Baker & Taylor, while elementary and middle school librarians favored Scholastic. Gumdrop was also popular among elementary school librarians. The use of other types of vendors increased with grade level.
Computers and cataloging
The days of a remote computer lab maintained by the school librarian seem over. On the other hand, the equivalent of one has moved into the library, with about seven out of eight media centers now housing a bank of computers. The median number of computers in the school library at the elementary and K–8 level was 9; at the high school level it was 25, and other levels had a median of 16 computers. Across the board, school librarians tended to buy a couple of computers and said they didn’t plan to buy another during the present school year.
As for book vendors, Follett was most cited as the library’s integrated library management system at all levels, about a third of the time. At a distant second (less than 5 percent of the time) was Alexandria. Surprisingly, in-house solutions came in third. SIRSI was fourth most popular, and TLC was fifth. No significant difference existed between school levels.
Cataloging was a function that often involved in-house, district, and vendor cataloging. About three out of four libraries at all levels cataloged in-house. A central system, usually at the district level, was used by 22 percent of elementary school libraries, 14 percent of middle school libraries, and 18 percent of high school libraries. Vendors were also used in cataloging: 43 percent of elementary schools, 46 percent of middle schools, and 53 percent of high school libraries.
Online computer catalogs seemed to go hand-in-hand with library computers; if the library had computers, it had an OPAC, which was accessible from all student stations—and between 85 and 90 percent (lowest at middle school and highest at high school) had classroom remote access; either all the classes or none had access to the library OPAC. These same libraries also had web home pages.
The school librarian maintained the web page at about 88 percent of elementary and middle school libraries, and 83 percent of high school libraries. In elementary and middle school settings a school technology specialist maintained the home page 6 percent of the time; about 10 percent of the time in high schools the technology specialist performed that function. District staff handled that job 2 percent of the time across levels.
Collaboration still isn’t second nature
Regardless of level, most school librarians plan with 20 percent or fewer of classroom teachers. Almost 10 percent of elementary school librarians did no planning with classroom teachers (in comparison to 5 percent of middle school and 3 percent of high school librarians). On the other hand, about 5 percent of elementary school librarians plan with more than 80 percent of classroom teachers in comparison with 6 percent of middle school and 1 percent of high school librarians.
A little more than half (52 percent) of elementary school libraries had fixed schedules, as opposed to less than 6 percent of middle school and 4 percent of high school libraries. About two-thirds of middle school and seven-eighths of high school libraries had flexible schedules. About a third of elementary and middle school libraries had a mix of flexible and fixed schedules.
About 40 percent of elementary school librarians did not talk with public librarians, perhaps because many of those sites are managed by paraprofessionals, while almost all middle and highs school librarians talked yearly with public librarians, and about a third of them talked a couple of times a term. In all cases, about a tenth talked more frequently than monthly with public librarians.
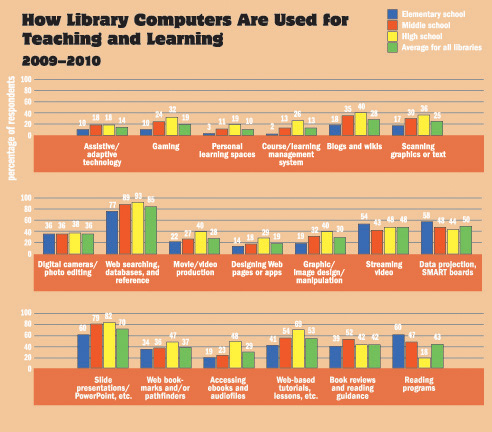
School librarians routinely incorporated technology into teaching and learning. The new AASL learning standards that encourage student production can be seen to be reflected in the technology uses in table 5. In general, technology use increased in the older grades, and reading programs such as Accelerated Reader and Reading Rockets continued to be used mainly in lower grades (but were used less than in previous years). Most technology uses listed in table 5 stabilized since our 2009 survey, which covered the 2007–2008 school year. However, access to ebooks and audio files has also jumped significantly: to almost half of high school libraries. Our current survey measured the following applications for the first time: gaming, movie production, course management systems, and personal learning spaces. The first two items seemed to have taken off to the greatest extent: about a third of high school libraries incorporate gaming, and almost 40 percent produce movies.
Using the data
About a third of the respondents used SLJ’s previous spending surveys or data, mainly when asking for a budget increase or as a resource for general library advocacy. The surveys helped people inform decision makers, particularly in terms of comparing resource support. Others respondents used the surveys as a site assessment tool, again to make comparisons nationally and to provide a benchmark for improving in resource allocation. Respondents have used the information to help in budget planning, technology acquisitions, and collection development and replacement. Library educators use it for school librarian preservice instruction and research.
Think globally, act locally
As Thomas Jefferson said, an informed citizenry is the only true repository of the public will. Now, more than ever, school librarians need to know how their colleagues are faring, if for no other reason than for equitable educational experiences for students around the country. That’s one of the main reasons we’re committed to doing these surveys.
With the growing use of technology, we were interested to see how school libraries were taking advantage of it. We discovered that technology is an integral part of most libraries in terms of collection development and retrieval, teaching and instruction, and program administration. Increasingly, collection development didn’t seem to quibble between access and ownership. Nor is the book format sacred: rather, the ideas are what are central, and the format accommodates learners. Technology acquisition decisions seemed to be site-based and student-centered. Both site and districts shared in resources and administrative functions relative to technology. Multiple teaching strategies incorporated technology, and facilitated student generation of knowledge products. One responded noted: “I feel like my job is changing, and I am struggling to keep up with the changes in technology.” Another school librarian rightly said: “The numbers may be small but I do not think that is a good measure of a successful library in today’s world of technology.” Furthermore, school libraries are having to address schoolwide technology efforts such as one-to-one laptop programs and open textbook initiatives, which can impact access to information.
Schools continue to be local entities, and school libraries derive much support from them in terms of resources, money, and time. Respondent comments indicated that local support—or the lack of it—can make or break the library’s effectiveness. So our final message for school librarians is this: make connections with your school and local community. Plan informally and formally with teachers, administrators, and public librarians. Share your stories and your successes. Build resources and services in response to local interests and needs. Express library needs in terms of how they are essential to student learning. And let those young voices speak on behalf of the library to their families. We need to involve our communities in supporting and advancing what we do.
| Author Information |
| Lesley Farmer (lfarmer@csulb.edu) coordinates the librarianship program at California State University Long Beach. |
About the study
In December 2010, the survey was emailed to SLJ’s nearly 26,000 newsletter subscribers: 833 returned the completed survey within the month. Almost 98 percent of those who responded to our survey work in public school libraries, while the remainder work in charter school libraries, and less than a handful work in private schools. Of those numbers, 45 percent work in elementary, or K–8, schools, about 20 percent in middle schools, almost 30 percent in high school or grade 7–12 libraries, and 0.5 percent in K–12 settings. Based on information from the National Center for Education Statistics, librarians from the Northeast and West were a bit higher represented proportionally, and those from the South were a bit under-represented (although that region had the highest proportion of elementary schools represented).

Added To Cart
RELATED


RECOMMENDED
CAREERS
The job outlook in 2030: Librarians will be in demand
CAREERS
The job outlook in 2030: Librarians will be in demand
ALREADY A SUBSCRIBER? LOG IN
We are currently offering this content for free. Sign up now to activate your personal profile, where you can save articles for future viewing
ALREADY A SUBSCRIBER? LOG IN
Thank you for visiting.
We’ve noticed you are using a private browser. To continue, please log in or create an account.
Add Comment :-
Be the first reader to comment.
Comment Policy:
Comment should not be empty !!!